Solutions / Finance and compliance
Cost and COGS reports
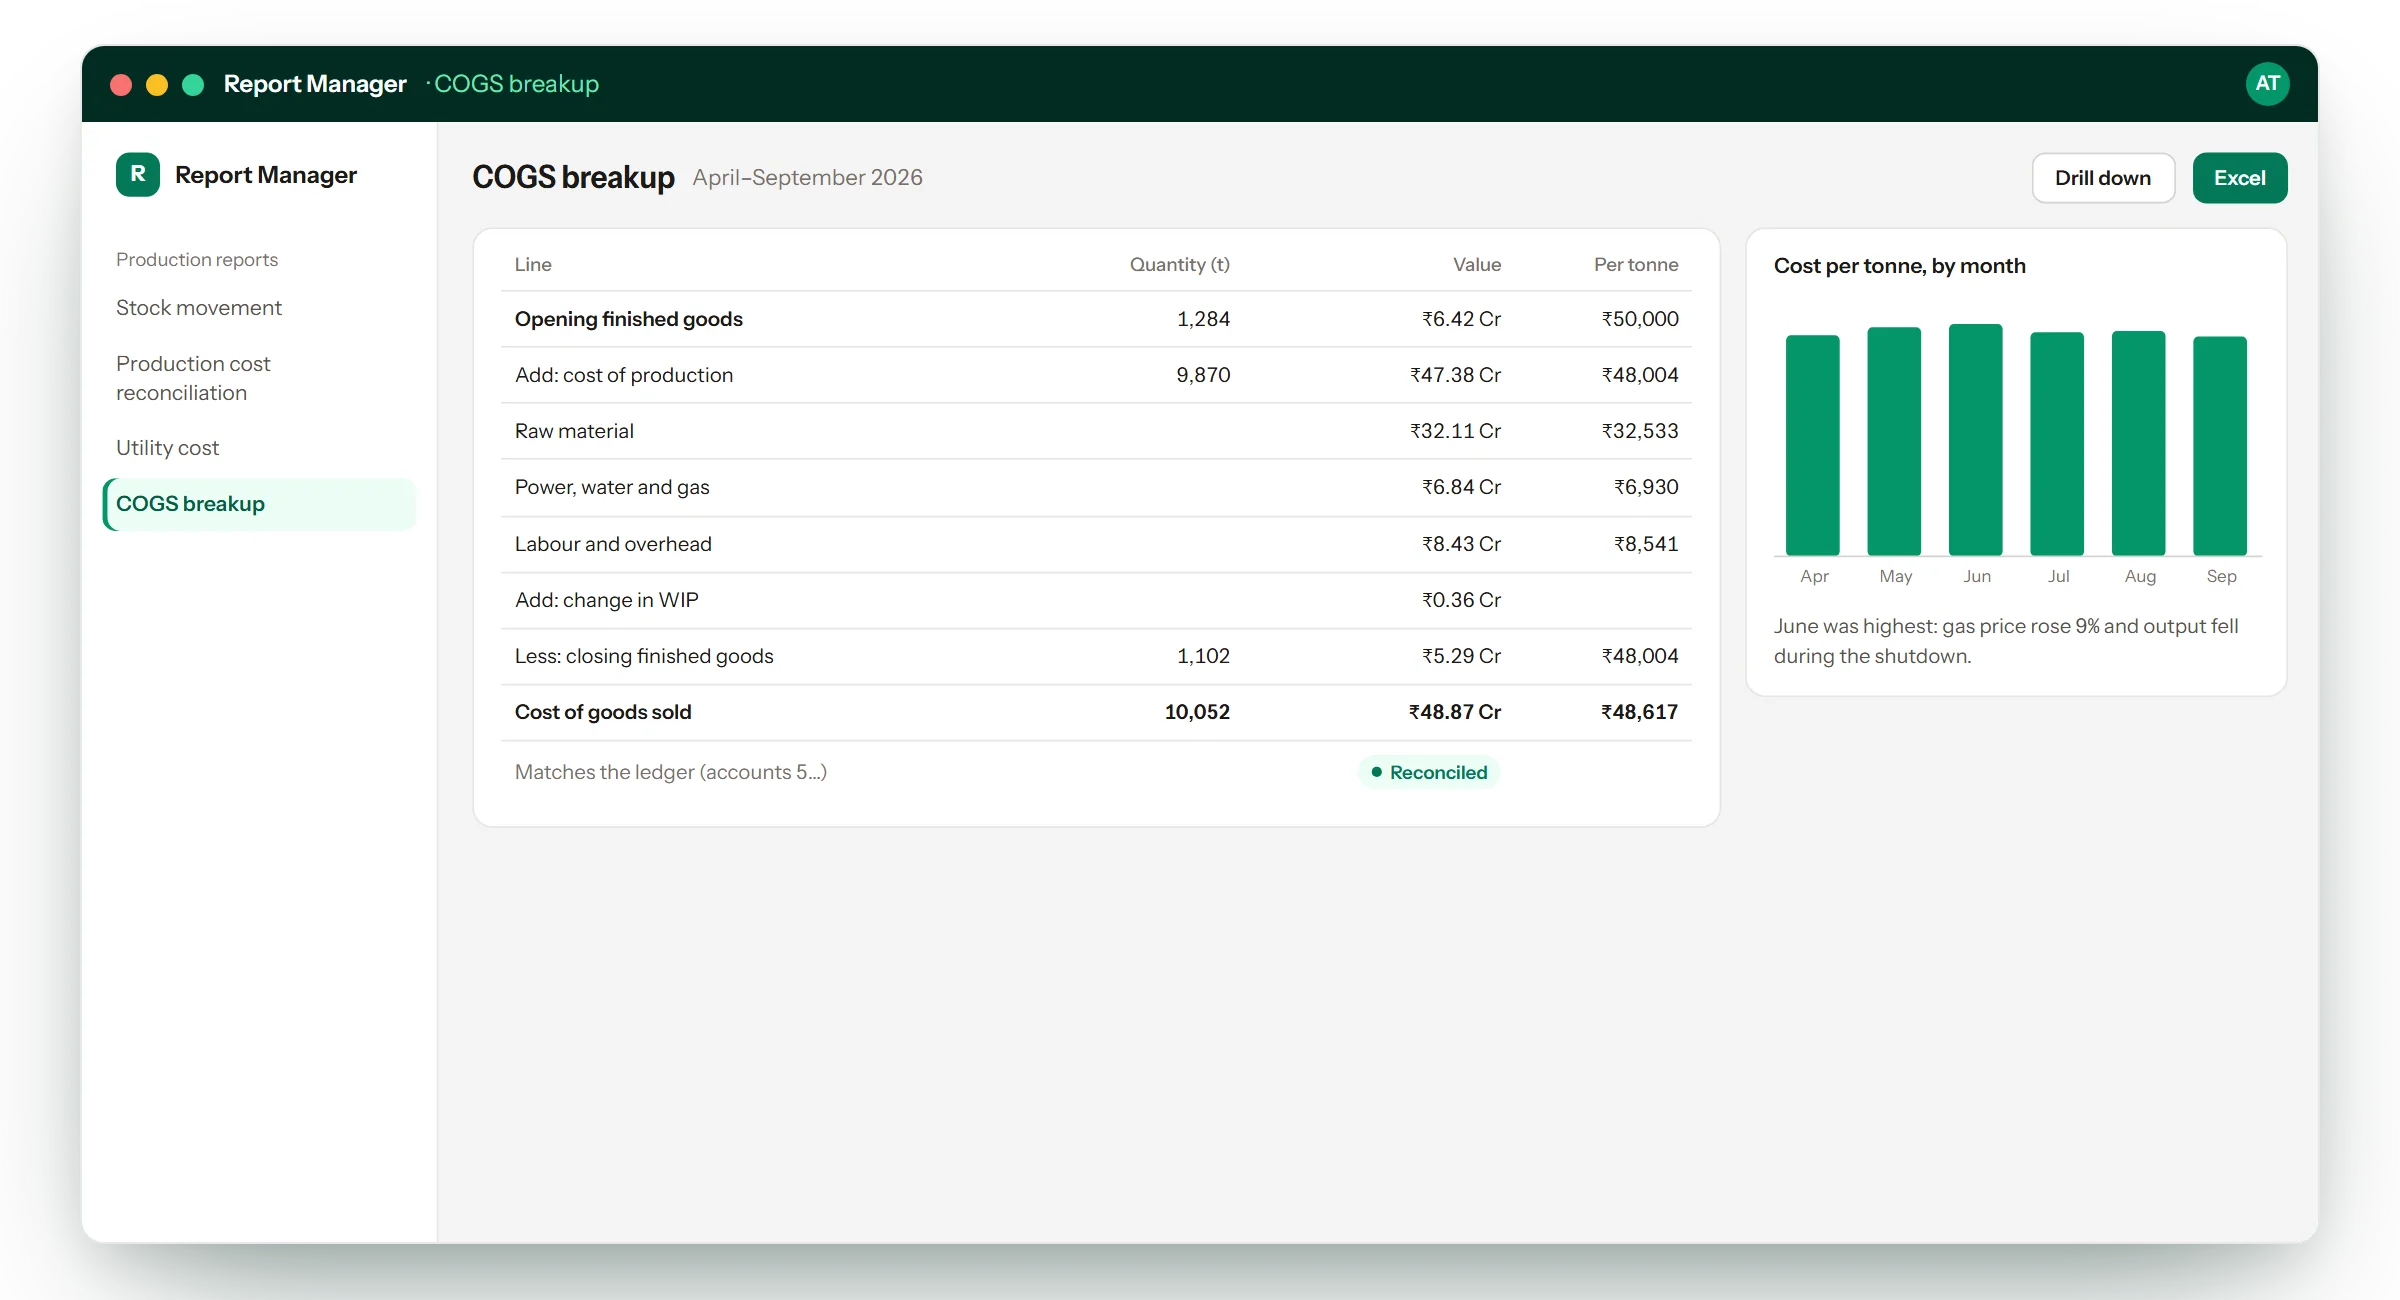
A set of production and stock cost reports inside SAP Business One: stock movement, production cost reconciliation, utility cost and a cost of goods sold breakup, each with drill-down to the documents and export to Excel.
The problem it solves
In a manufacturing company the cost of goods sold is built from material, power, labour, work in progress and stock movement, and the standard reports do not lay it out that way. Finance ends up rebuilding it in a spreadsheet every month, and the spreadsheet never quite agrees with the ledger.
What it does
- Stock movement: opening stock, purchases, production, sales, issues, transfers, revaluation and closing, in quantity and value
- Production cost reconciliation: input against receipt by product, with variances and WIP
- Utility cost: power, water, gas and other direct costs, by month or by plant
- COGS breakup: cost of production, WIP and finished goods movement to cost of goods sold, checked against the system figure
- Double-click any line to see the documents behind it
- Every report and drill-down exports to Excel
What changes for the business
- The month-end cost picture comes out of SAP instead of a spreadsheet
- A difference from the ledger is flagged on the report, not found later
- Cost per unit by month shows which input moved, and when
Related solutions
All fourteen
See it working.
Ask for a demo of Cost and COGS reports and we will walk you through it on a sample company — and tell you honestly whether it fits how you work.