Solutions / Reporting and analytics
Hiyantra Analytics
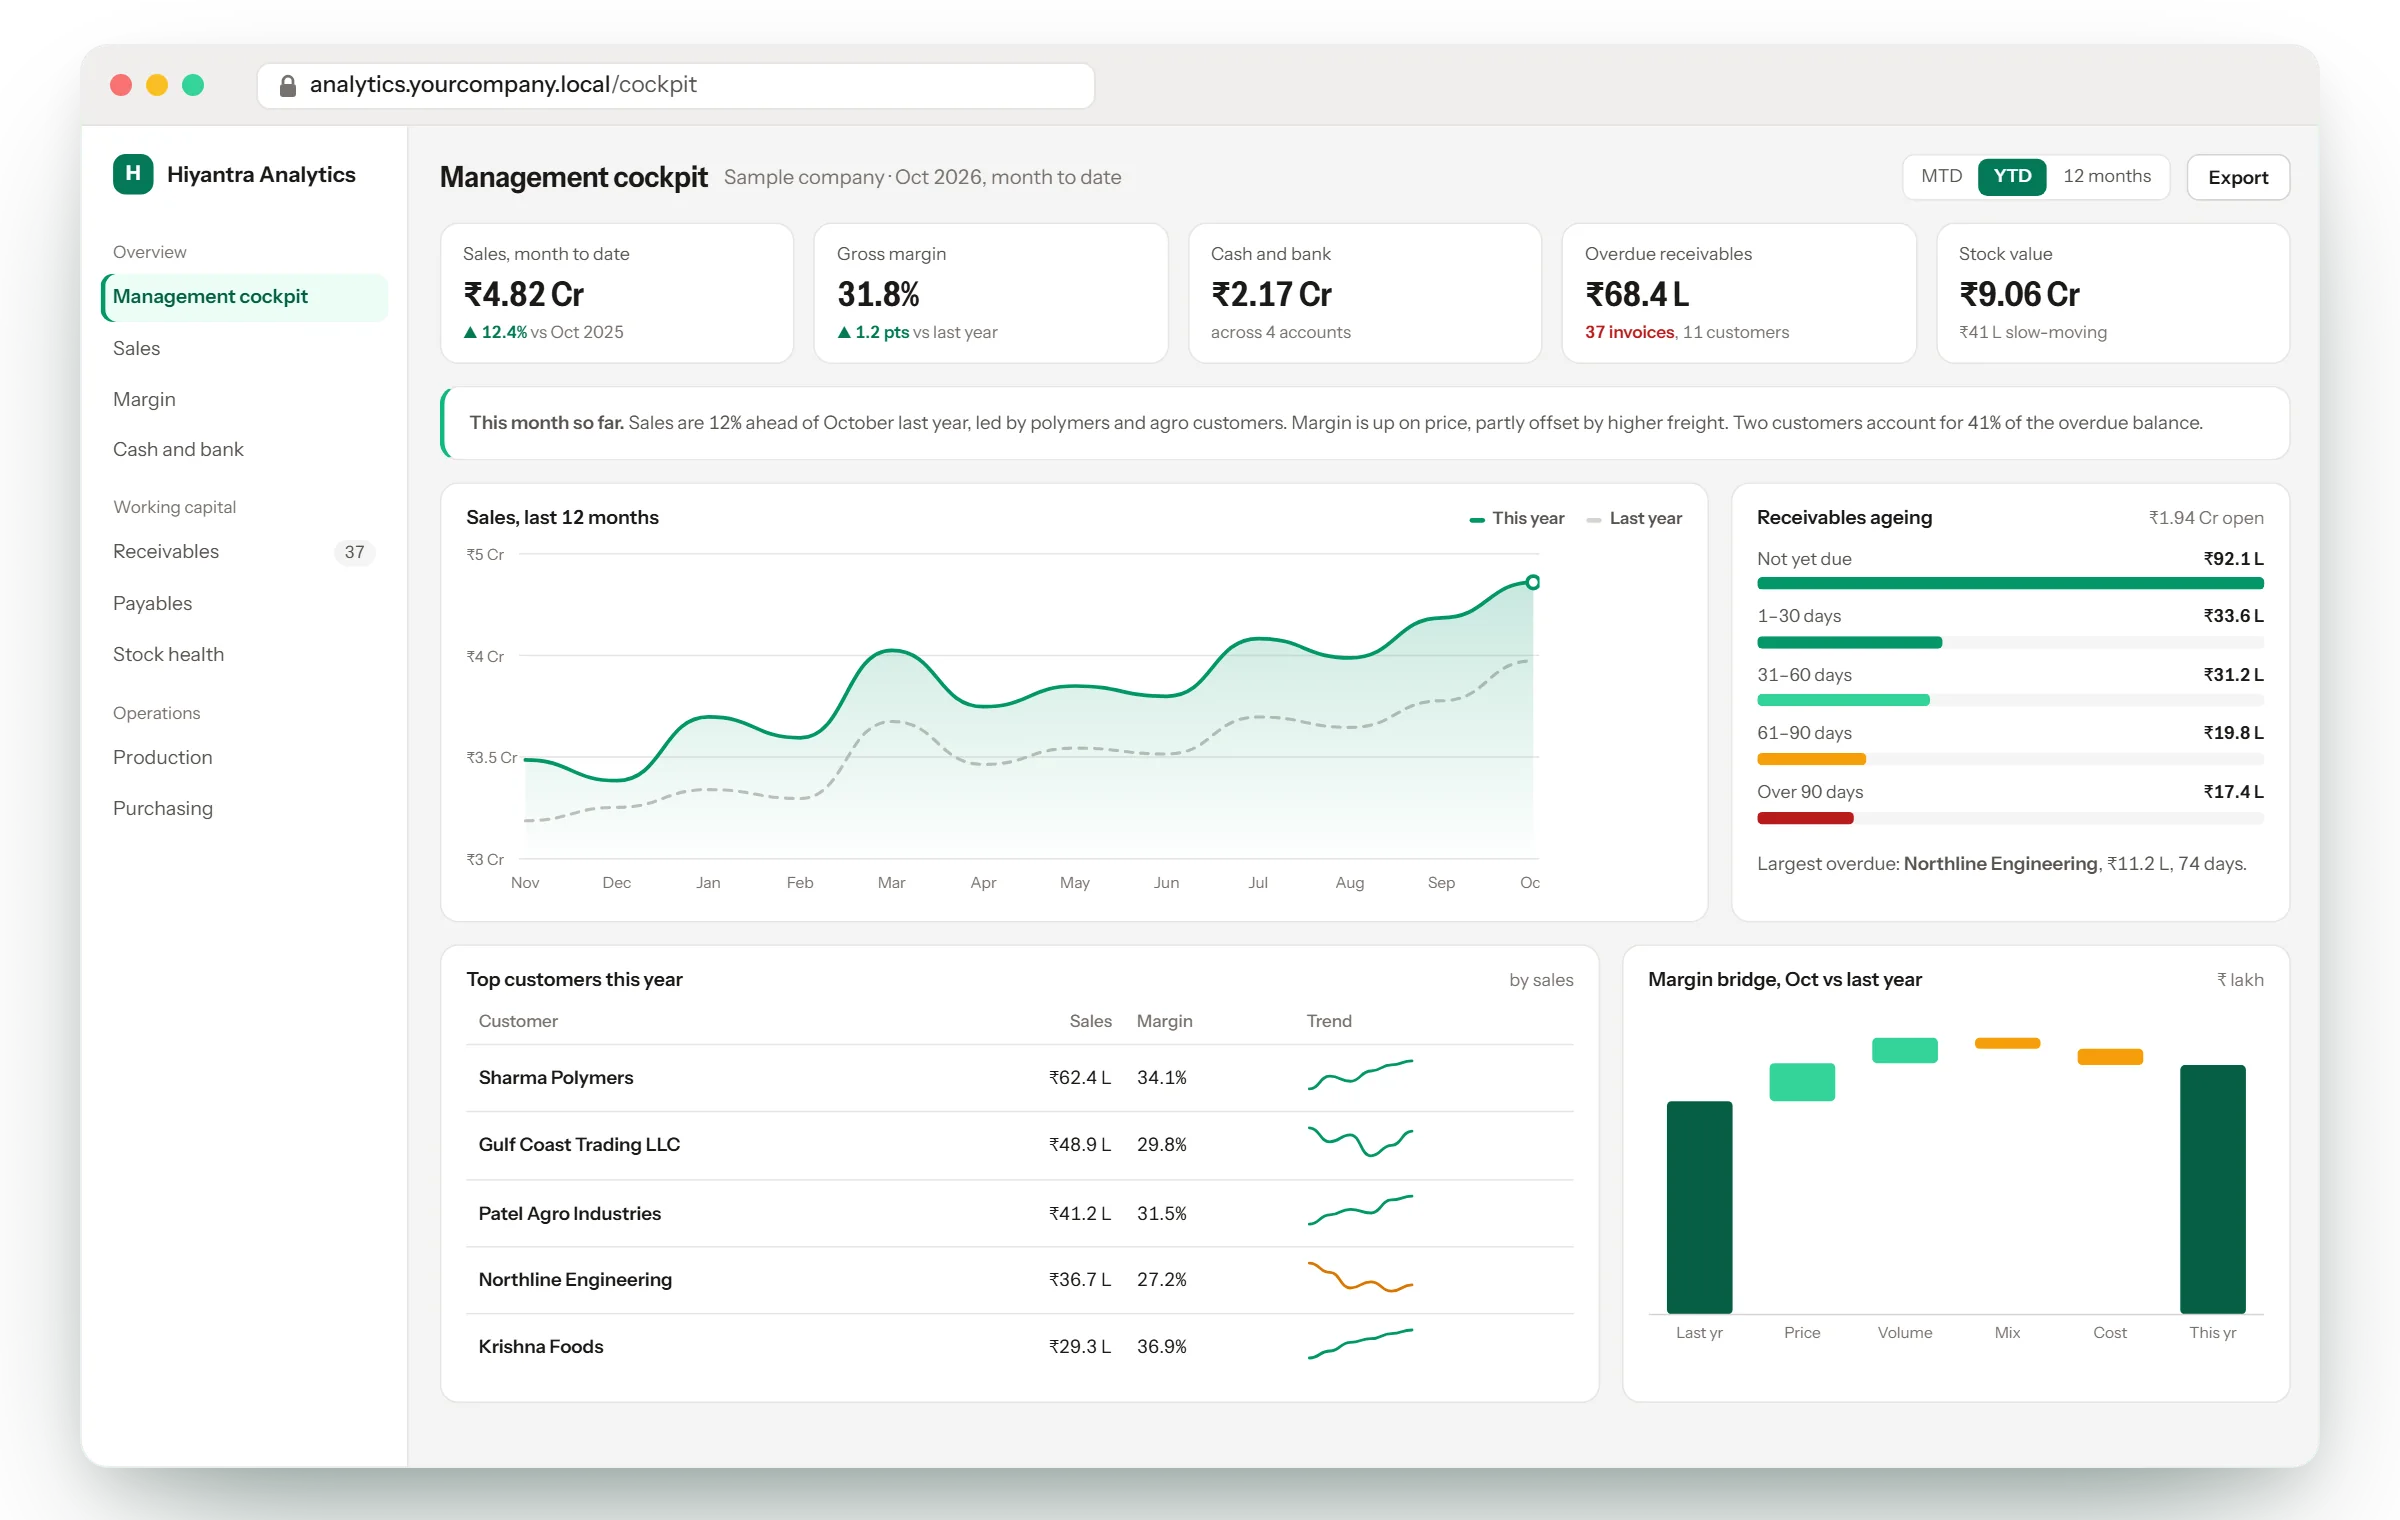
Hiyantra Analytics is a management cockpit for SAP Business One: sales, margin, cash, receivables, payables, stock and production on one page, with a plain-English summary of the period, and every number opening to the documents behind it.
The problem it solves
Management asks how the business is doing and the answer arrives days later, as a spreadsheet somebody built from several reports. By then the question has moved on, and nobody can say which documents a figure came from.
What it does
- Main figures: sales month and year to date against last year, gross margin, net profit, cash and bank, overdue receivables, stock value
- A written summary of the period in plain English
- Sales trend with last year, margin bridge (price, volume, mix and cost), customer and product views
- Receivables ageing and top overdue customers; cash position over time
- Drill-down everywhere: number, detail, document list, document lines
- Reads SAP with a read-only user and a time limit on every query, so the live system is safe
What changes for the business
- Management sees the month as it happens, not after the close
- Every figure can be traced to the SAP documents behind it
- Problems such as a customer drifting overdue are visible while there is time to act
Related solutions
All fourteen
See it working.
Ask for a demo of Hiyantra Analytics and we will walk you through it on a sample company — and tell you honestly whether it fits how you work.